Bangor,
Gwynedd a Humming Paradox OR ‘If the LFN phenomenon the world over known as the
Hum is associated with renewable energy, especially wind power, why in Bangor
does it appear to maximise when total UK
wind energy output troughs but does not cease?’ By Dr Chris Barnes,
manager Bangor Scientific and Educational Consultants e-mail manager@bsec-wales.co.uk First published
without full reference list February 2016.
Abstract
The
question ‘if the LFN phenomenon the world over known as the Hum is associated
with renewable energy, especially wind power, why in Bangor does it appear to maximise when total UK wind
energy output troughs but does not cease?’ is posed and theoretically answered.
Experimental data based on personal
observation of the Hum and real-time behaviour of wind generation and the
National Grid generally
support the answers. Once again an
undeniable connection between the Bangor Hum and Power Systems has been demonstrated. A observation that the Hum maximises at lulls in wind
energy but not with total cessation of wind generation has been experimentally supported.
The connection between the Bangor
Hum and Dinorwig Pumped storage scheme has also been supported by this
work. A new observation is the connection between the Hum and power flows in HVDC interconnectors has
been established and tentatively explained.
Since we now have a ‘Smart Grid’
it ought to be possible to devise power flow algorithms to either a)
reduce or eliminate the Hum completely or b) distribute its e3ffects so no one
part of the country is overburdened by them.
Introduction
The Hum is an unusual LFN
phenomena first reported extensively in Britain in the 1970’s and later in the
USA in the 1990’s. Although some
properties of the Hum, in particular descriptions of the perceived auditory
effects such as for example idling
engine noises and pulsating buzzing by
those afflicted appear at first sight to be those of Infrasound (refs), a
distinction has been drawn by Leventhal
in the Hums are described as LFN where the source cannot readily be
traced.
The world temporal
evolution of the Hum can only be
conveniently explained by a
complex hypothesis involving interaction of the World’s power systems. Indeed,
the Hum is now reported in virtually all corners of the globe and only countries which do not use
significant amounts of renewable energy and do not have PME mains electricity
earth systems appear to have escaped (refs).
To fully account for all
the propagation and perception properties of the Hum including actual first
hand and anecdotal reports one reaches the conclusion that the Hum is far more
than just a noise and may, in fact, be augmented by a magnetic and or
gravitational means of perception in addition to just normal audition (refs).
Based on visits to a
website which is a database for logging instances of the Hum around the world,
it would seem that the phenomenon is presently most associated with renewable
energy, particularly the use of wind energy and in some cases pumped
storage hydro-power, particularly
employing Francis turbines ( ref Bangor and Italy). These
types of energy are more likely to be able to supply the complex sets of
coherent or quasi-coherent acoustic, infrasound, seismic and electromagnetic or
electro-gravitational signals which
constitute the Hum (refs). For example,
I have previously shown that some high voltage power grids exhibit instability
and may even act as electro-seismic parametric amplifier systems under
excitation by wind energy and when driving or being driven by Francis Turbines
( refs).
Other types of signal may
also complicate the Hum, for example there may be present acoustic, infrasound
or seismic signals arising from other public utility services ( refs) and/or
the Hum may have a preternatural component ( ref).
The presence of such
multiple sources contributing to the Hum
is thought to be the case in Bangor and has been suggested as accounting for its complex
behaviour as a function of wind speed and
direction (ref). There is even
the possibility of Bragg matching with certain radio frequency sources (ref).
The paradox here in
Bangor and elsewhere appears to be that the Hum maximises during lulls of
overall UK wind generation capacity yet where wind generation output does not cease completely.
The real-time data to show this
has only recently become available on the internet ( REF).
It is the purpose of this
brief publication to attempt to elucidate this paradox and to explore if there
may be any alternative explanation to the complex behaviour of the Bangor Hum
as a function of wind speed.
It is convenient to
consider each of the potential Hum component sources in turn and as if arriving
from wind energy. One must then consider
the effect of local and overall wind speed on the generation and propagation of such
components.
Acoustic
sound and Infrasound Windfarms ( propagation)
Wind farms are known
sources of acoustic sound and infrasound.
The acoustic sound is known to be more annoying when wind farms exhibit
OAM ( other amplitude modulation). The
peak part of the OAM spectrum is …. Hz and would not be expected to propagate
very far. There are, however, LFN and infrasound components to some OAM and
wind farm emissions which can travel significant distances of tens of
kilometres at night in a stable boundary layer.
A stable boundary layer
will be destroyed by excessive turbulence, i.e. excessive wind speed and hence
if windfarm emissions are a component of
the Hum they would not be expected to propagate far in very strong winds. The
wind farms which could influence a Hum in Bangor are at …… and North Hoyle ,
some …. Km and …..Km distance.
Thus propagation of sound
from a windfarm is favoured by no or gentle wind rather than strong wind. Clearly if there is absolutely no wind, no
emissions will be generated.
This behaviour supports
the experimental observation that Hum in Bangor peaks during Lulls in total
wind power generation.
Windfarms
(generation)
When wind speed
fluctuates or when wind is variable in direction windfarms are more likely to
generate OAM and infrasound. Such
fluctuations in speed and sudden
changes in direction which cause more
OAM and Infrasound will be accompanied
by Lulls in total wind power generation and this too supports the
observation.
Power
grid Electromagnetic emissions ( Harmonic, sub and inter-harmonic )
Lulls in total wind power
generation must logically be accompanied by wind speed reduction at some but not all wind farms. When the wind speed reduces and changes
direction suddenly not only is OAM generated but power disturbances are
also maximised (refs). Phase imbalance will be maximised due to way
wind farms are laid out. Ground current
flows are also maximised. Harmonic
emission to space will also be maximised.
If magnetic perception is
relevant or partially relevant to the Bangor
Hum it too should maximise during such ‘Lulls’.
Seismic
signals
The main seismic source
in Bangor which could contribute to the Hum is Dinorwig. During Lulls in wind power generation at
night Dinorwig represents a large load at the end of a long transmission
line. Electrical and hyrdo-acoustic
instability will tend to go hand in hand and any transmitted seismic signals
will reflect this.
Experimental
The
author keeps a careful log of Hum intensity and type ( i.e. the extent to which
it appears to incorporate magnetic component) and has done for several years. The most profound observation is that
‘magnetic ‘ Hum outbreaks which were once very rare now appear to be much more
commonplace especially during January 2016.
It is noted that reactor 2 at Wylfa ceased generating on 25 April 2012
and reactor 1 stopped generating on 30th December 2015.
Based
on all my prevoius hypotheses of the Hum I would expect the Hum to get worse
after these events as the power grid in this area will be significantly weaker
particularly at night when Dinorwig is
pumping.
It
has only become possible to make a more precise estimation of the effect of
wind generation on the Bangor Hum since the advent of the availability of
real-time data at
http://winderful.diascreative.net/ an example is shown
below.

And at :
http://nationalgrid.stephenmorley.org/
where also a more complex breakdown of all types of UK
electricity generation can be found togather with details of interconnector
imports/exports.
Using the above site data
has been obtained for the month of January
2016 and compared with the subjective Hum level at the author’s
home. It should be noted that there was never a day
when there was no wind generation and wind generation at any one time varied
from 0.14 -5 GW across the period.
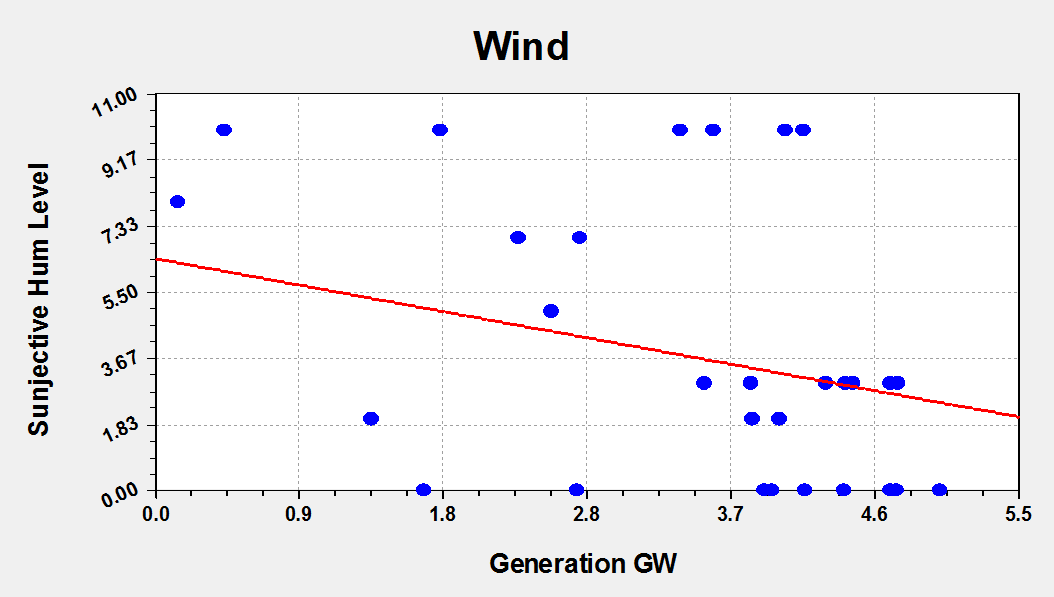
At first sight it would
seem that by extrapolation Hum level maximises at zero wind generation but
since there was never a time when zero generation took place it would be
unreliable to deduce the same. However, it is safe to assume that Hum levels
peak at the minimum value of generation
and that result is generally in support of
the proposed hypothesis. Furthermore the trend for decreasing Hum
levels with increasing wind generation
could be synonymous with increasing wind speed and hence increasing masking
noise.
I have previously
suggested that the Bangor Hum is comprised of multiple Infrasound and LFN
sources and have shown a complex behaviour ( sinusoidal) for each source as a
function of wind speed (ref). If the
sources are wind farms or influenced by the acoustic or electrical output of
windfarms I would expect a polynomial solution to the above function ( subjective
Hum as a function of wind generation). I
propose a minimum of say a cubic
function on the baits of multiple propagation paths and maybe this could be
scaled to a 6th degree polynomial
the basis of differences of wind speed at the two most local wind
farms.
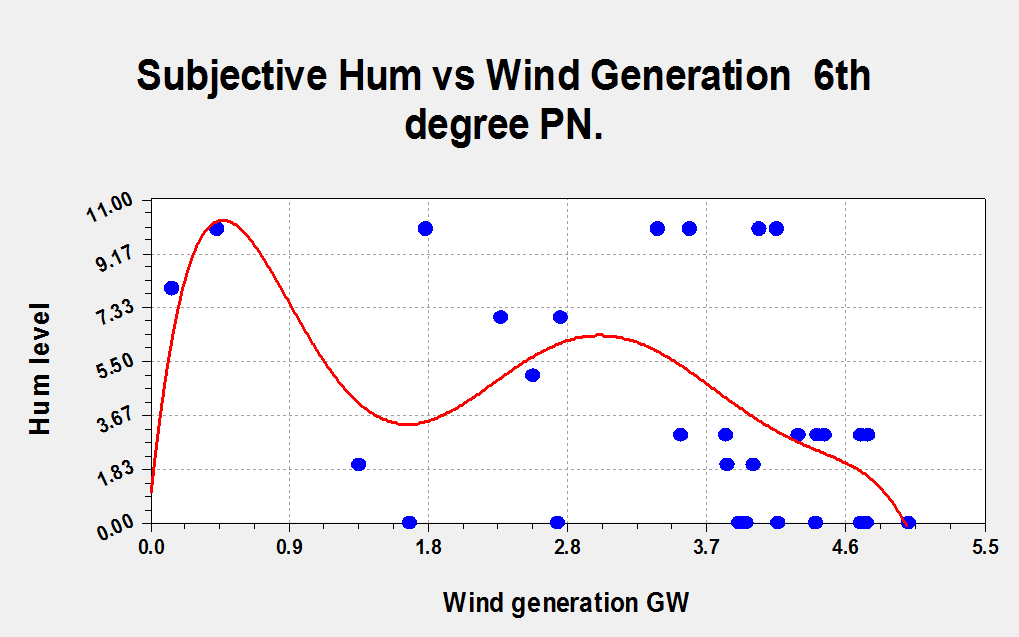
P Value Results
r=.53 DF=29
The two-tailed P value equals 0.0022
By conventional criteria, this difference is
considered to be very statistically significant.
Applying this polynomial
suggest that there is a finite but weaker Hum level in the absence of wind
generation. High wind speed can
presumably provide masking noise and
disrupt the coherence of Hum from whatever cause.
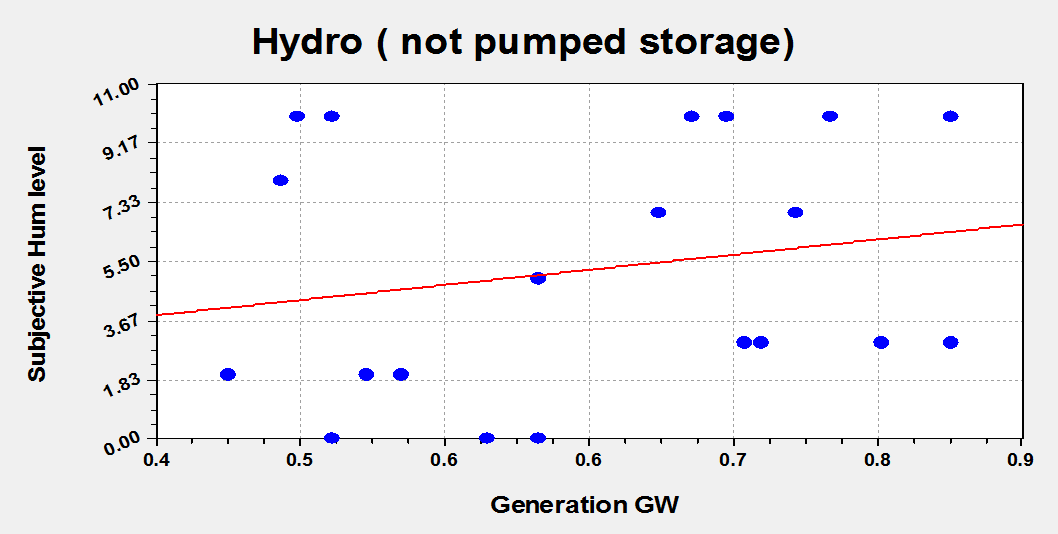
As wind generation falls,
other methods of generation are brought on line. The plot below shows how conventional hydro-
power ( not pumped storage ) can
influence subjective Hum levels in Bangor.
The website http://nationalgrid.stephenmorley.org/ does
not give detail of power used whilst pumped storage is pumping but merely tells
how much is generated on a given day.
An assumption previously
made in Bangor and Italy ( and with
substantial experimental evidence
together with theoretical support) is that Francis style turbines lead
to Hum.
Thus if the residual Hum
not due to wind power is due to Pumped Storage one might expect a good
correlation between a night’s subjective Hum and the next day’s use of pumped storage energy since predictive
algorithms are commonplace in the power industry.
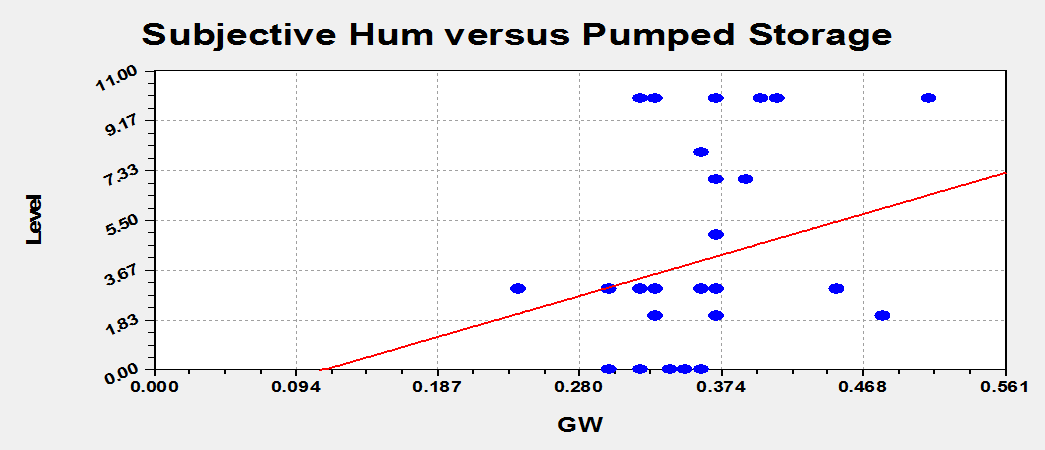
P =.05 i.e. just
statistically significant.
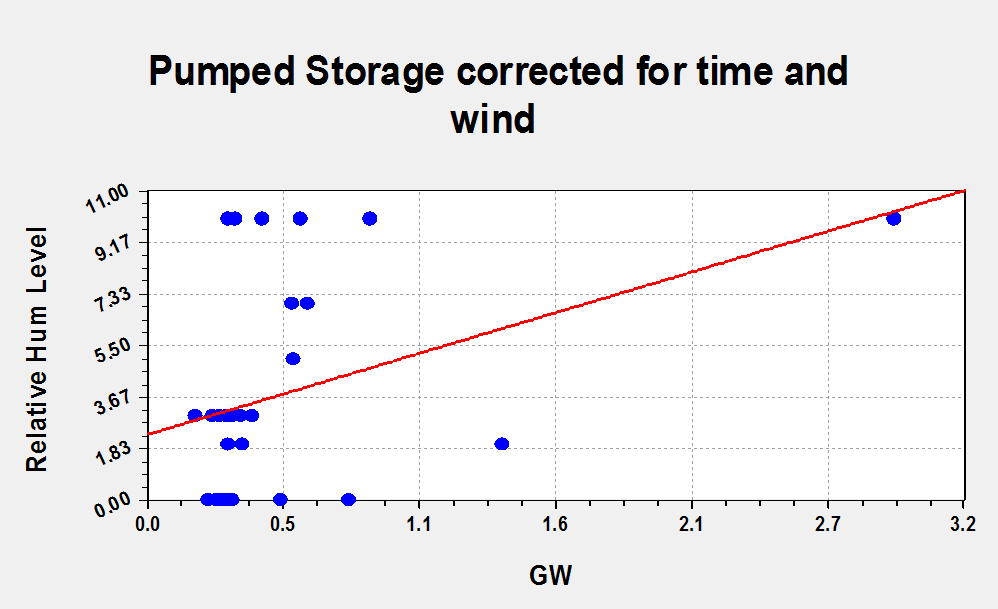
P=.038 i.e. more statistically significant.
D.C. Interconnectors
D.C. Interconnectors were first introduced to the
UK Electricity Grid in the 1960’s. A 160 MW cross channel system (1961) was first
introduced, superseded by a 2 GW system in
1986.
The HVDC Moyle
Interconnector is the HVDC link between Auchencrosh, South Ayrshire in Scotland
and Ballycronan More, County Antrim in Northern Ireland, which went into
service in 2001. It is owned and operated by Mutual Energy.
The HVDC Moyle has
capacity of 500 MW. It consists of two monopolar 250 kV DC cables with a
transmission capacity of 250 MW each. The converter stations are completely
equipped with light triggered thyristors.
As of October 2011, the interconnector was out of service, repair
efforts were and the cable became operational again with 450 MW in February
2012
BritNed Development
Limited is a joint venture of Dutch TSO TenneT and British National Grid and
operates the electricity link between Great Britain and The Netherlands which
was commissioned in 2011. The maximum
power rating of the BritNed interconnector is 1GW.
The 500 MW East West
interconnector between Wales and Ireland was completed on 20 September 2012 it
was inaugurated in Meath by UK secretary for energy and climate change Ed
Davey, Irish prime minister Enda Kenny and European Commissioner for Energy
Günther Oettinger. It is meant to allow
better utilisation of energy, particularly renewables.
Such interconnectors can
cause excessive and abnormal harmonics, see for example Ainsworth (1967) and thus could be implicated in the Hum. See also Larsen et al (1989). Although grid interconnection can reduce
voltage flickers it is notorious for other types of degradation of power quality,
see Shilpi et al (2013). Non-characteristic
frequencies such as inter-harmonics can also occur with HVDC systems, see Hulme
et al (2003). Inter-harmonics
can provide unwanted acoustic noise in
power systems, see http://admin.copperalliance.eu/docs/librariesprovider5/power-quality-and-utilisation-guide/311-interharmonics.pdf?sfvrsn=4&sfvrsn=4.
See also Lin (2011). I have also commented extensively on this elsewhere, http://www.drchrisbarnes.co.uk/POWERGRID.htm.
Although theoretically HVDC Interconnectors
ought to damp inter-area oscillations, few practical examples exist, see Vural
(2016).
The site at http://nationalgrid.stephenmorley.org/ contains details of imports/exports on the
various UK Electricity interconnectors.
I have explored the relationship between these values and the relative
Hum intensity during January 2016.
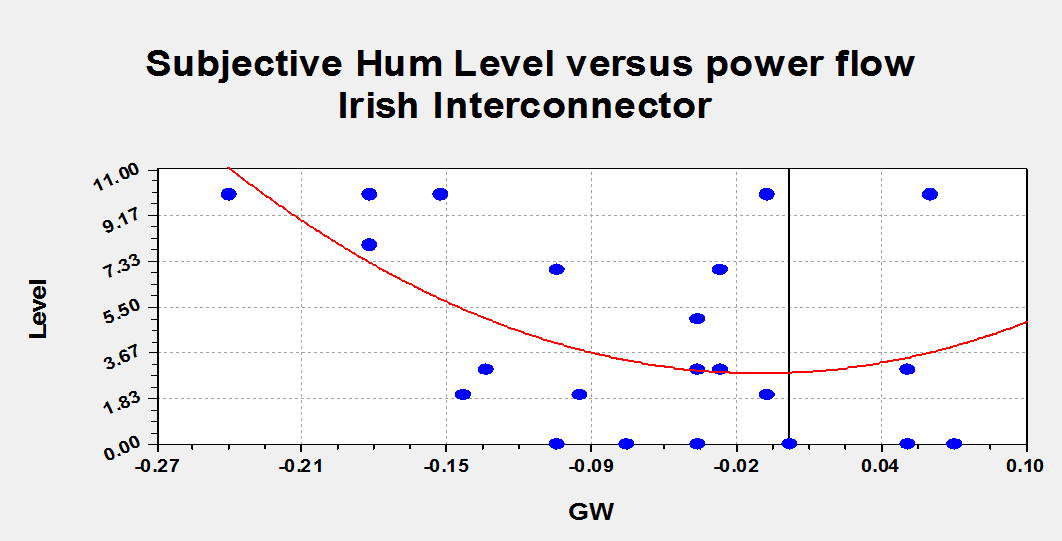
Above: Power
Flow Irish/Wales DC Interconnector Circa 9
Hum level points range. R=.6
P Value Results
r=.6 DF=22
The two-tailed P value equals 0.0019 so by conventional criteria, this difference
is considered to be very statistically significant.
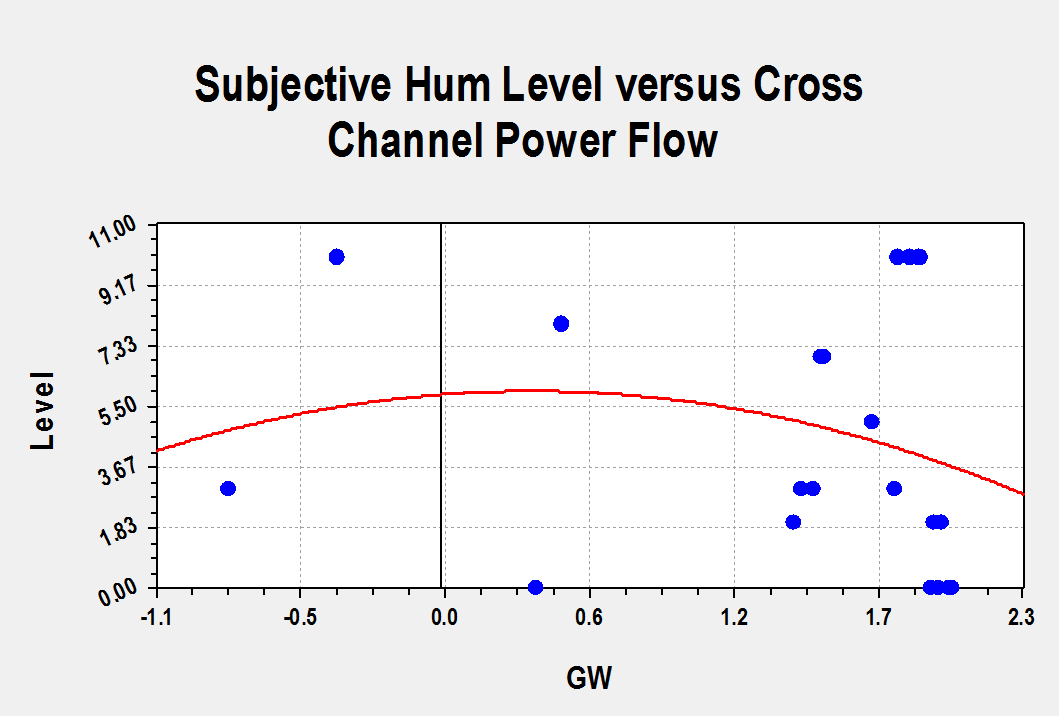
Above: Cross
Channel Power Flow Circa 1.5 Hum Level
Points Range. R=.42
P
Value Results
r=.42 DF=15
The two-tailed P value equals 0.0933
By conventional criteria, this difference is
considered to be not quite statistically significant.
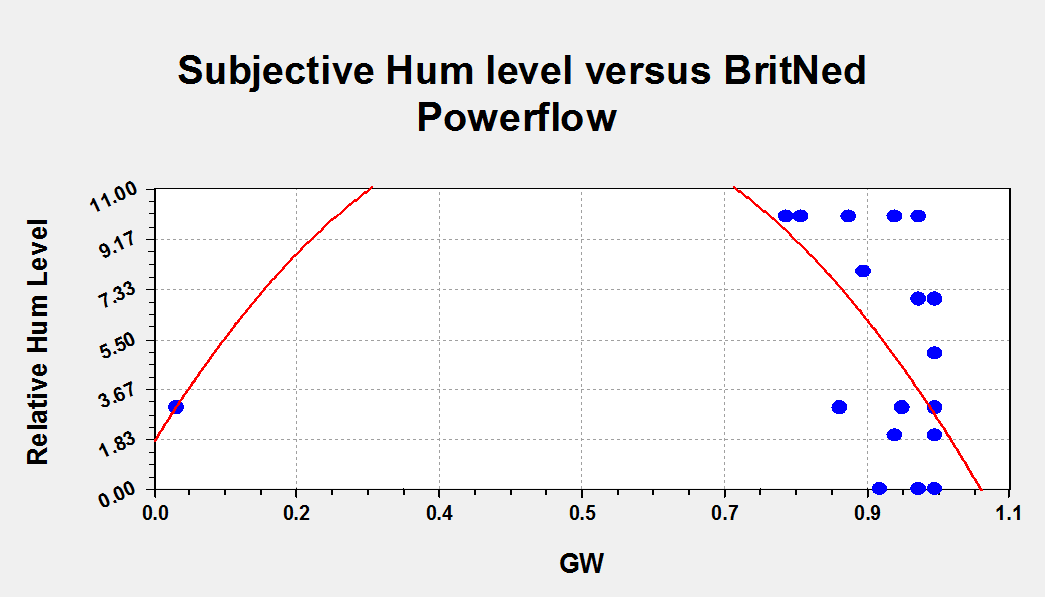
Above
Britnet Power Flow Circa 8 Hum Level
Points Range.
P Value Results
r=.34 DF=15
The two-tailed P value equals 0.1818
By conventional criteria, this difference is
considered to be not statistically significant.
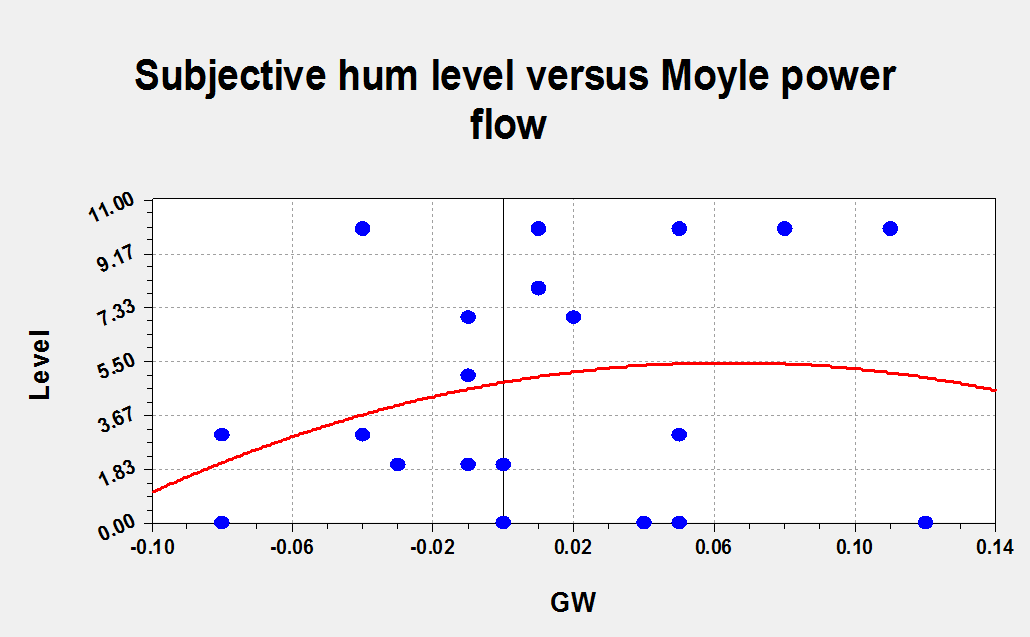
Above: Moyle Interconnector Power Flow Circa 4.5
Hum Power Points Range. R=.27
P Value Results
r=.27 DF=20
The two-tailed P value equals 0.2243
By conventional criteria, this difference is
considered to be not statistically significant.
Interconnectors
Discussion
In each case a quadratic
equation provides best correlation. Perhaps to be expected given the potential
for two way power flow. Although only
the Irish Interconnector produces a statistically significant result, the result
from the Cross Channel Connector is almost significant. The large scatter is due to the fact that
multiple power sources in each network all contribute separately and singly in
some way to Hum behaviour and there will be no too days in which airborne
acoustic and ground borne seismic and space-weather are identical.
The results are very
revealing and support all my prevoius
work and deductions on the Hum. It is perhaps not surprising that given the
proximity of Bangor to both the power grid and the sources of renewable energy
that feed the Irish Interconnector that it should have most effect on the
Bangor Hum. Indeed the Hum minimises when there is no power flow in that
Interconnector. It is interesting that
Hum maximises when there is maximum import or export of electricity across the
Interconnector. Harmonics and inter-harmonics and radiation
to space, ground currents and acoustic
noise will all potential facets of the Hum will maximise and power quality will minimise
under these conditions and almost uniquely
with the Irish inter-connector wind
energy will be one of the major sources of power from either side of the Irish
Sea. I have previously raised the issue of sporadic
Hums cropping up in various parts of Britain after changes in our National Grid
system which will affect power flows, such as closures of certain power stations(
ref). This present work certainly seems
to reinforce those ideas.
Although not too statistically
relevant, Hum level seems to minimise when
Power Flow from the cross-channel Interconnector
maximises. Presumably the stronger European
Grid confers additional stability onto the UK grid or alternatively and
additionally we are generating less renewable energy at these times. A similar
although not statistically relevant effect
is noted with the Britned Interconnector. The result with the Moyle Interconnector is
also not statistically relevant but suggests that Hum levels in Bangor minimise
at Maximum export to Northern Ireland.
Two reasons could explain this.
Firstly less dirty electricity is flowing into the National Grid from
Scotland at these times and/or secondly very high wind levels are allowing such export
and when the wind blows hard in Scotland, it usually blows form the West or South
West and will be blowing similarly in North Wales and providing masking noise
and disturbing coherence of Hum
signals.
Conclusions
Once
again an undeniable connection between the Bangor Hum and Power Systems has
been demonstrated. A observation that the Hum maximises at lulls in wind energy
but not with total cessation of wind generation has been experimentally supported. The connection between the Bangor Hum and Dinorwig Pumped
storage scheme has also been supported by this work. A new observation is the connection between the Hum and
power flows in HVDC interconnectors has been established and tentatively explained. Since we now have a ‘Smart Grid’ it ought to be possible to devise power flow algorithms
to either a) reduce or eliminate the Hum completely or b) distribute its e3ffects
so no one part of the country is overburdened by them.